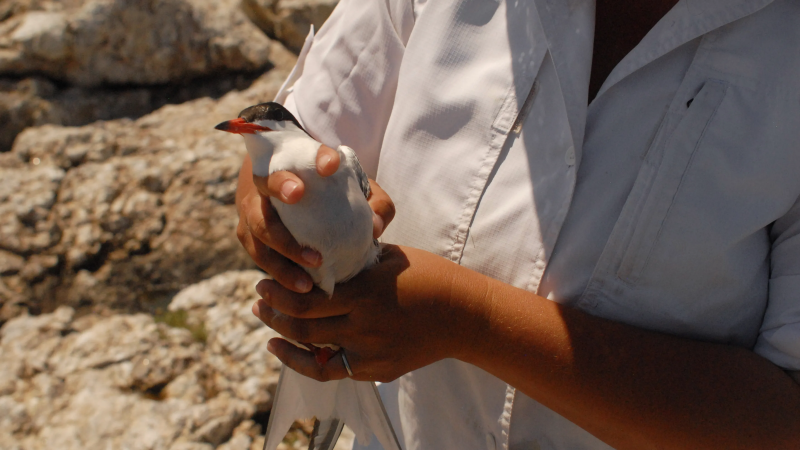
What's causing massive seabird die-offs? Warming oceans part of ecosystem challenges
From albatrosses to puffins, a string of major seabird die-offs along the Pacific coast have caused alarm amid a summer where nearly half of global oceans are experiencing record-breaking heat waves.
Seabird populations face a growing risk from oceans as they warm due to climate change, suggests a recent study led by researchers at the University of Washington. While the study analyzed findings from the northeast Pacific Ocean, its serious implications are cause for concern amongst scientists elsewhere.
The study revealed that seabird die-offs were more likely to occur during elevated sea surface temperatures, which researchers’ defined as reaching above the 90th percentile for at least six days. If temperatures hovered up to 1 degree Celsius – about 1.3 degrees Fahrenheit – warmer than usual for six months or longer, five times as many birds died.
“This is unprecedented,” marine biologist Timothy Jones, a lead author of the study, said, in a description of the research findings on the University of Washington website.
The analysis measured the magnitude of mortality events, regardless of seabird species, by sifting through nearly 30 years of data on volunteer-collected surveys of beach-cast birds, or the rate of carcasses washing in, between central California and Alaska.

USA TODAY, Ipsos poll:20% of Americans fear climate change could force them to move
How do warmer ocean surface temperatures impact seabirds’ ecosystem?
The Earth just sweltered through its hottest June-August ever, European scientists announced Wednesday. “Our planet has just endured a season of simmering – the hottest summer on record," United Nations Secretary-General Antonio Guterres said in a statement. "Climate breakdown has begun."
Higher temperatures change the composition of the plankton community, seabirds’ usual prey, and provide ideal conditions for disease outbreaks or algal blooms, researchers told Audubon Magazine in a story about the University of Washington research.

Massive mortality events normally occur once per decade
Between 2014 and 2019, five massive mortality events occurred between central California and Alaska with death tolls most likely exceeding a quarter million birds, according to the study. Researchers are concerned because prior data shows that these events had previously occurred naturally only roughly once per decade.
“Each individual mortality event was among the largest mortality events that have ever been documented anywhere in the world,” Jones told Audubon Magazine. “And then it just continued year after year.”
Marine heat waves aren’t the only reason mortality events occur, but they’re making die-offs more probable and a much more serious issue, study co-author Julia Parrish, a University of Washington seabird expert, told Audubon Magazine.

Heat wave led to the hottest three months ever, plus warming oceans
Scientists blame human-caused climate change from the burning of coal, oil and natural gas, with an extra push from a natural El Niño, which is a temporary warming of tropical Pacific Ocean water. El Niño is forecast to intensify and linger through at least the end of this year.
- August had the warmest global monthly average ocean-surface temperatures on record, at nearly 70 degrees (F). Temperatures beat the prior record (March 2016) each day in August, according to the World Meteorological Organization. July, August and June were the hottest three months ever, according to the Copernicus Climate Change Service.
- The extent of sea ice in Antarctica also was at a record low level for August, with a monthly value of 2% below average, easily the "largest negative anomaly" for the month since the late 1970s, when records began, the WMO said.
- Sea surface temperatures in many areas outside the polar regions have been warmer than normal since March. In April and May, they were highest on record for those months in a series of data dating back to 1850, said the United Kingdom’s Met Office, the national weather service for the U.K.
Are warm records being broken more often?
Yes. Statistically, weather records could be compared to a bell curve, with the most frequently observed temperatures along the high peak of the curve and the unusually warm and cold temperatures at either end where the curve tapers off, Karin Gleason, chief of the monitoring section at NOAA's National Centers for Environmental Information, told USA TODAY's Dinah Voyles Pulver.
But, in stations across the globe, the curve has shifted to the right, Gleason said. Average temperatures have increased, and the frequency of new warm records being set has increased.

Contributing: Doyle Rice,Dinah Voyles Pulver
Disclaimer: The copyright of this article belongs to the original author. Reposting this article is solely for the purpose of information dissemination and does not constitute any investment advice. If there is any infringement, please contact us immediately. We will make corrections or deletions as necessary. Thank you.


